Glutamate Assay
L-Glutamate Activation: Oocytes expressing recombinant human glutamate receptors are perfused with Barth's solution containing (in mM): NaCl (90), KCI (1.0), BaCl2 (0.5), HEPES (10), and EDTA (0.01), adjusted to pH 7.4 (at 23 degrees C) with NaOH. The oocyte membrane potential is clamped at -40 mV. Oocytes are then exposed to increasing concentrations of L-glutamate (concentration varies depending on the specific receptor and variant tested) for 1 min duration each in the continuous presence of 100 M glycine to obtain dose-effect data. Results at each L-glutamate concentration are normalized to the maximum receptor activation levels achieved (defined as 100%). The data are fit to obtain an EC50 value for each oocyte according to Equation 1 (below). Statistical comparison between WT and Variant receptor results is made using a two-tailed unpaired t-Test on the log values of the EC50's (GraphPadPrism5.0).
Equation 1: Response = 100/((1+ EC50 / [agonist] ) nH), where EC50 is the agonist concentration that elicited the half maximal response, and nH is the Hill slope.
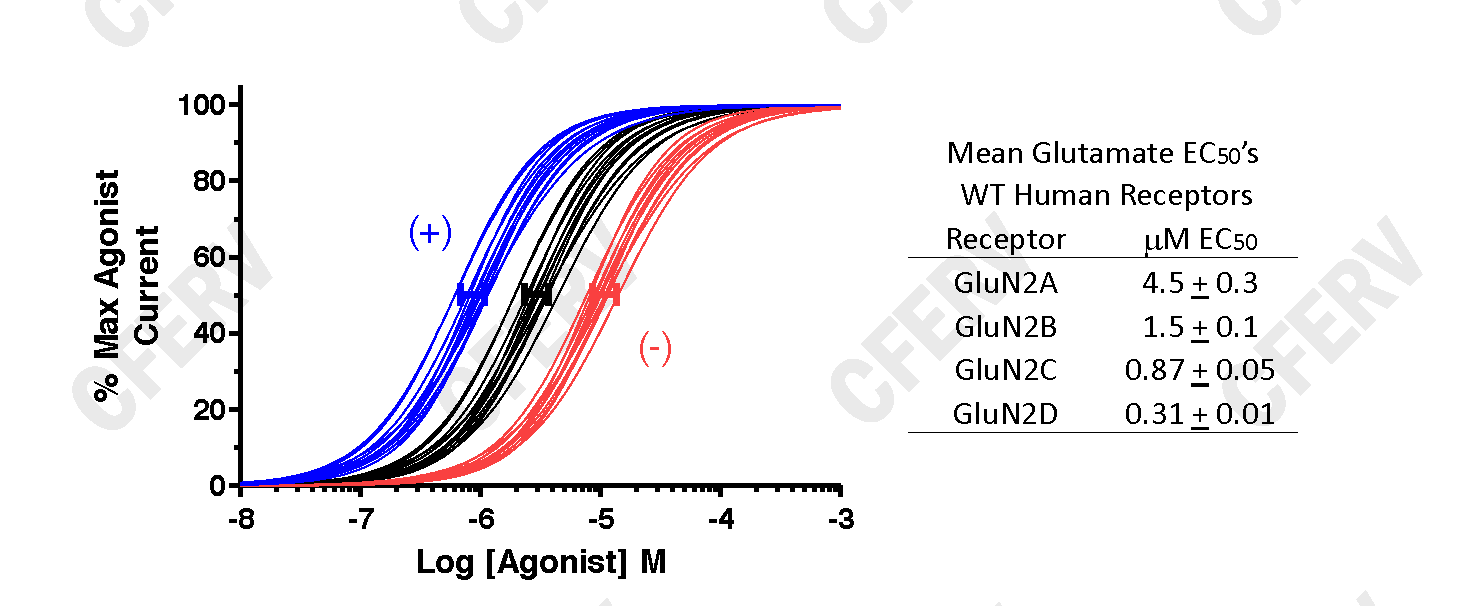
The graph above shows data fits using Equation 1 for agonist activated glutamate receptors. The Black Lines are fits from WT expressing oocytes, the Blue Lines from oocytes expressing a variant receptor with an increase in agonist potency and the Red Lines from oocytes expressing a variant receptor with a decrease in agonist potency. The solid bars (blue, black, red) represent 95% confidence intervals about the mean EC50 for each set of curves. The (+) and (-) indicate that these shifts in potency result in an increase or a decrease in receptor activity, respectively. Data in Table to the right from Hedegaard et al. (2012) Neurochem Int, 61:601.
Glycine Assay
Glycine Activation: Oocytes expressing recombinant human glutamate receptors are perfused with Barth's solution containing (in mM): NaCl (90), KCl (1.0), BaCl2 (0.5), HEPES (10), and EDTA (0.01), adjusted to pH 7.4 (at 23 degrees C) with NaOH. The oocyte membrane potential is clamped at -40 mV. Oocytes are then exposed to increasing concentrations of glycine (concentration varies depending on the specific receptor and variant tested) for 1 min duration each in the continuous presence of 100 UM L-glutamate to obtain dose-effect data. Results at each glycine concentration are normalized to the maximum receptor activation levels achieved (defined as 100%). The data are fit to obtain an EC50 value for each oocyte according to Equation 1 (below). Statistical comparison between WT and Variant receptor results is made using a two-tailed unpaired t-Test on the log values of the EC50's (GraphPadPrism5.0).
Equation 1: Response = 100/((1+ EC50 / [agonist] ) nH), where EC50 is the agonist concentration that elicited the half maximal response, and nH is the Hill slope.
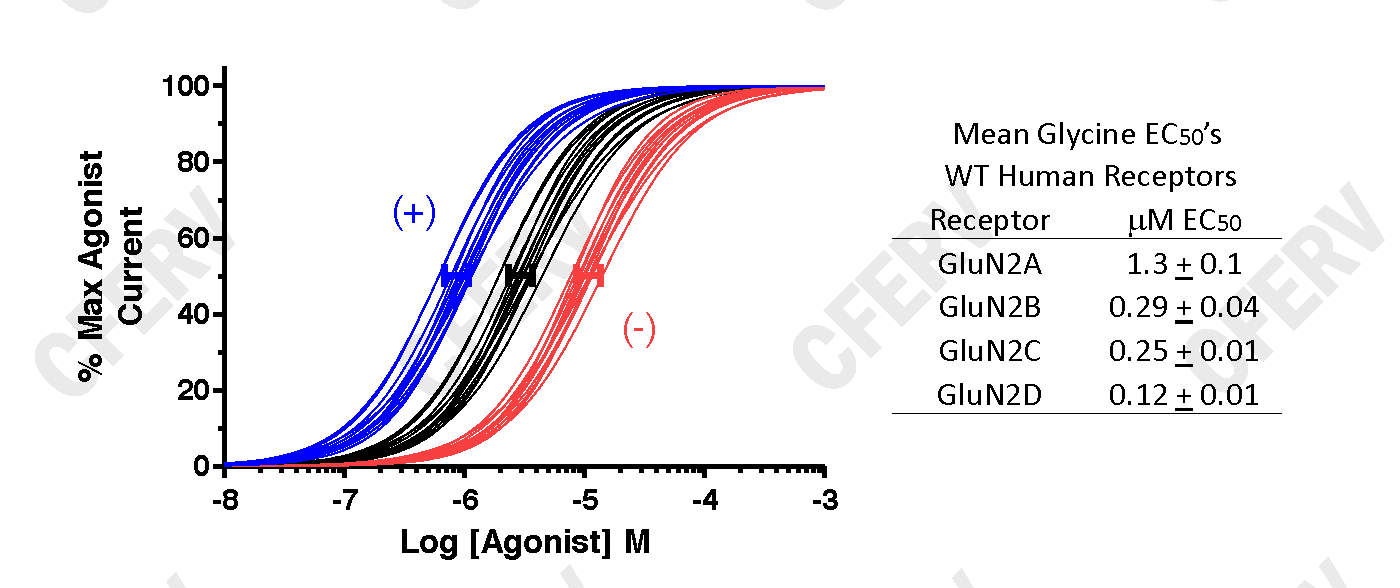
The graph above shows data fits using Equation 1 for agonist activated glutamate receptors. The Black Lines are fits from WT expressing oocytes, the Blue Lines from oocytes expressing a variant receptor with an increase in agonist potency and the Red Lines from oocytes expressing a variant receptor with a decrease in agonist potency. The solid bars (blue, black, red) represent 95% confidence intervals about the mean EC50 for each set of curves. The (+) and (-) indicate that these shifts in potency result in an increase or a decrease in receptor activity, respectively. Data in Table to the right from Hedegaard et al. (2012) Neurochem Int, 61:601.
pH Assay
pH inhibition studies: Oocytes expressing recombinant human glutamate receptors are perfused with Barth's solution containing (in mM): NaCl (90), KCI (1.0), BaCl2 (0.5), HEPES (10), and EDTA (0.01), adjusted to either pH 6.8 or pH 7.6 (at 23 degrees C) with HCl or NaOH. The oocyte membrane potential was clamped at -40 mV. After a steady baseline was obtained in pH 7.6 recording buffer the oocytes were maximally activated with 100 UM L-glutamate and 100 M glycine in pH 7.6 buffer. Following a washout period to reestablish baseline, the oocytes were then maximally activated with 100 UM L-glutamate and 100 M glycine in pH 6.8 buffer. The current at pH 6.8 is then compared to the current at H 7.6 (defined as 100%). Statistical comparison between WT and Variant receptor results is made using a two-tailed unpaired t-Test (GraphPadPrism5.0).
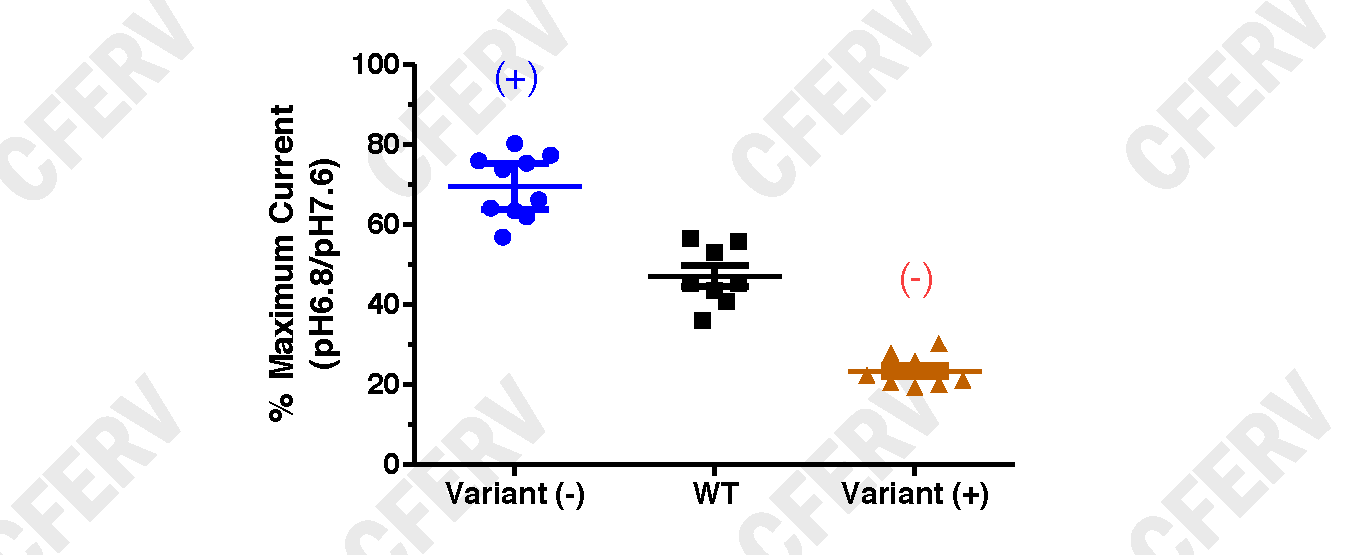
The graphs above shows a scatterplot of individual oocyte pH inhibition results for glutamate receptors. The Black Symbols are from WT expressing oocytes, the Blue Symbols from oocytes expressing a Variant receptor with a decrease in pH inhibition resulting in an increase in receptor activity (+), and Red Symbols from oocytes expressing a Variant receptor with an increase in pH inhibition resulting in a decrease in receptor activity (-). The solid bars (blue, black, red) over the data points the represent the mean and 95% confidence intervals (CI) about the means for each data set.
Magnesium Assay
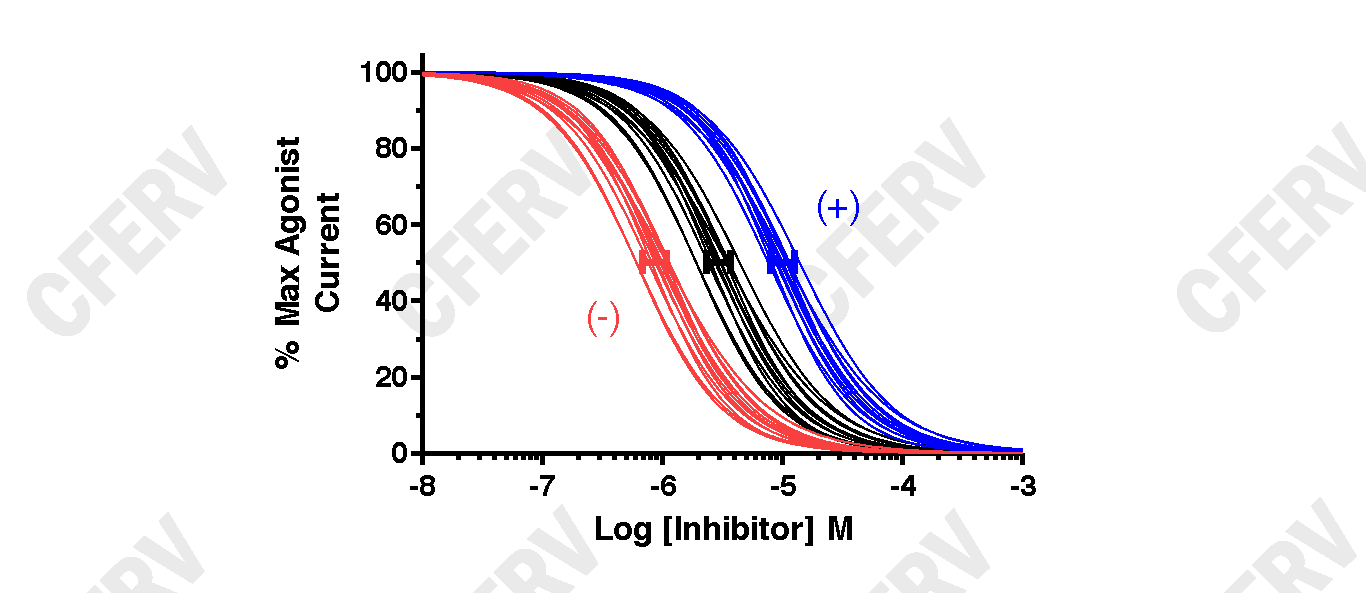
Mg2+ dose inhibition studies: Oocytes expressing recombinant human glutamate receptors are perfused with Barth's solution containing (in mM): NaCl (90), KCI (1.0), BaCl2 (0.5), and HEPES (10) adjusted to pH 7.4 (at 23 degrees C) with NaOH. The oocyte membrane potential is clamped at -60 mV. After a steady baseline is obtained, oocytes are maximally activated with 100 UM L-glutamate and 100 um glycine, and then in the continuous presence of maximal glutamate and glycine are perfused with increasing concentrations of Mg2+ (concentration varies depending on the specific receptor and variant tested). Results at each Mg2+ concentration are normalized to the maximum receptor activation levels without Mg2+ (defined as 100%) and IC50 values obtained by fitting concentration-inhibition data with Equation 2 (below). Statistical comparison between WT and Variant receptor results is made using a two-tailed unpaired t-Test on the log values of the IC50's (GraphPadPrism5.0).
Equation 2: Response = (100 - minimum)/(1+ ([concentration] / IC50)nH) + minimum, where minimum is the residual percent response in saturating concentration (constrained to > 0) of Mg2+, IC50 is the concentration of antagonist that causes half maximal inhibition, and nH is the Hill slope.
Zinc Assay
Zn2+ dose inhibition studies: Oocytes expressing recombinant human glutamate receptors are perfused with Barth's solution containing (in mM): NaCl (90), KCI (1.0), BaCl2 (0.5), Tricine (10), and HEPES (10) adjusted to pH 7.3 (at 23 degrees C) with NaOH. The oocyte membrane potential is clamped at -20 mV. After a steady baseline is obtained, oocytes are maximally activated with 50 MM L-glutamate and 50 M glycine, and then in the continuous presence of maximal glutamate and glycine are perfused with increasing concentrations of Zn2+ (concentration varies depending on the specific receptor and variant tested). Results at each Zn2+ concentration are normalized to the maximum receptor activation levels without Zn2+ (defined as 100%) and IC50 values obtained by fitting concentration-inhibition data with Equation 2 (below). Statistical comparison between WT and Variant receptor results is made using a two-tailed unpaired t-Test on the log values of the IC50's (GraphPadPrism5.0).
Equation 2: Response = (100 - minimum)/(1+ ([concentration] / 1C50)nH ) + minimum, where minimum is the residual percent response in saturating concentration (constrained to > 0) of Zn2+, IC50 is the concentration of antagonist that causes half maximal inhibition, and nH is the Hill slope.
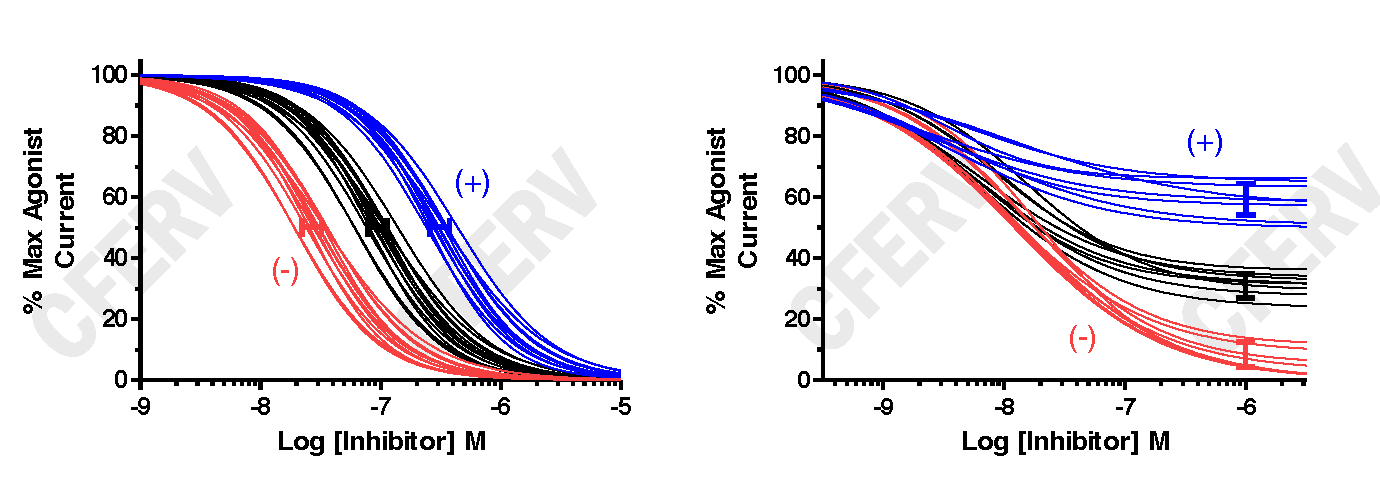
The graphs above shows data fits using Equation 2 for glutamate receptors. The Black Lines are fits from WT expressing oocytes, the Blue Lines from oocytes expressing a Variant receptor with a decrease in antagonist potency (left graph) or a reduction in the maximal inhibition (right graph), and Red Lines from oocytes expressing a Variant receptor with an increase in antagonist potency (left graph) or enhanced maximal inhibition (right graph). The solid bars (blue, black, red) represent the 95% confidence intervals (CI) about the means for each set of fit curves. The (+) and (-) indicate an increase or a decrease in receptor activity, respectively.