This week's images come to us from Chris Dudley, Ira Leeds, and Kevin Little. Using M-mode, they were able to obtain information on different moving structures within the body. When using M-mode the ultrasound machine presents information in a different way. To use this mode, press the M-mode button on the machine. A cursor line will appear. Using the trackpad/ball you can move this line over your selected area of interest within the 2-D image. Press M-mode again and the ultrasound will plot the changes in the brightness of the echoes under the cursor line over time. Make sure to hold your hand very still and anchor on the patient so your object of interest stays in the correct position under the cursor.
Image 1
 .
.
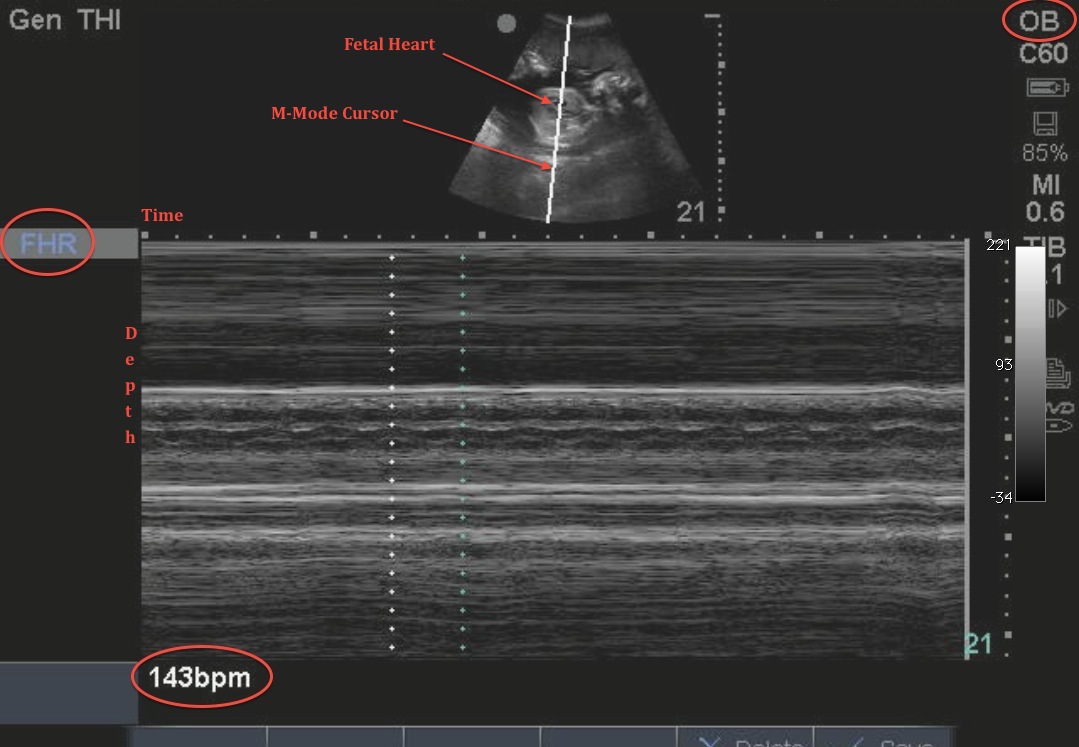
In this image, the M-mode cursor is placed over the fetal heart. The sinusoidal pattern is the movement of the heart with each cardiac cycle. By measuring the length of a single cardiac cycle the machine can calculate the fetal heart rate. This can provide valuable information in determining fetal viability.
Image 2
 .
.
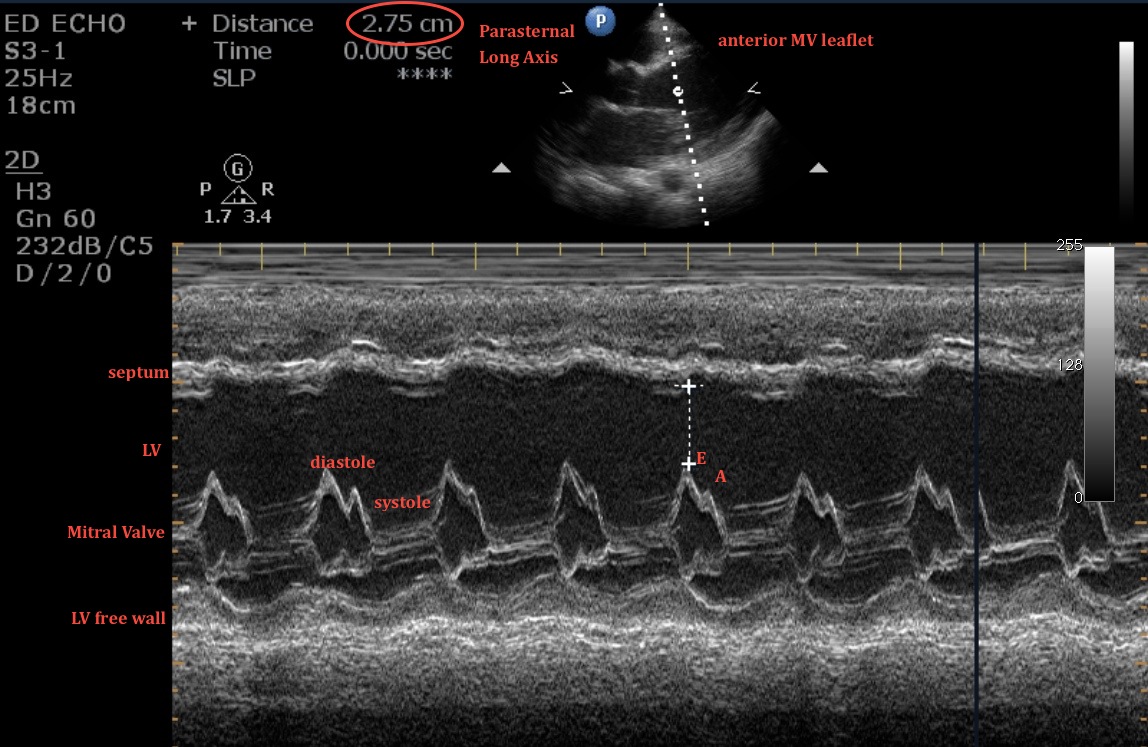
In this image, we have obtained a parasternal long-axis view of the heart. The M-mode cursor is placed over the distal tip of the anterior leaflet of the mitral valve. We can see how the anterior and posterior leaflets open during diastole and close during systole. We are using this image to calculate the E-point to septal separation or EPSS. This distance between the valve and the septum at the beginning of diastole is a marker of LV systolic function.
If the distance is:
- <6mm: there is normal LV function
- 6mm-12mm: there is moderately depressed function
- >12mm: there is a severely depressed function
In the above image the distance is 27.5mm, representing severely decreased.
Image 3
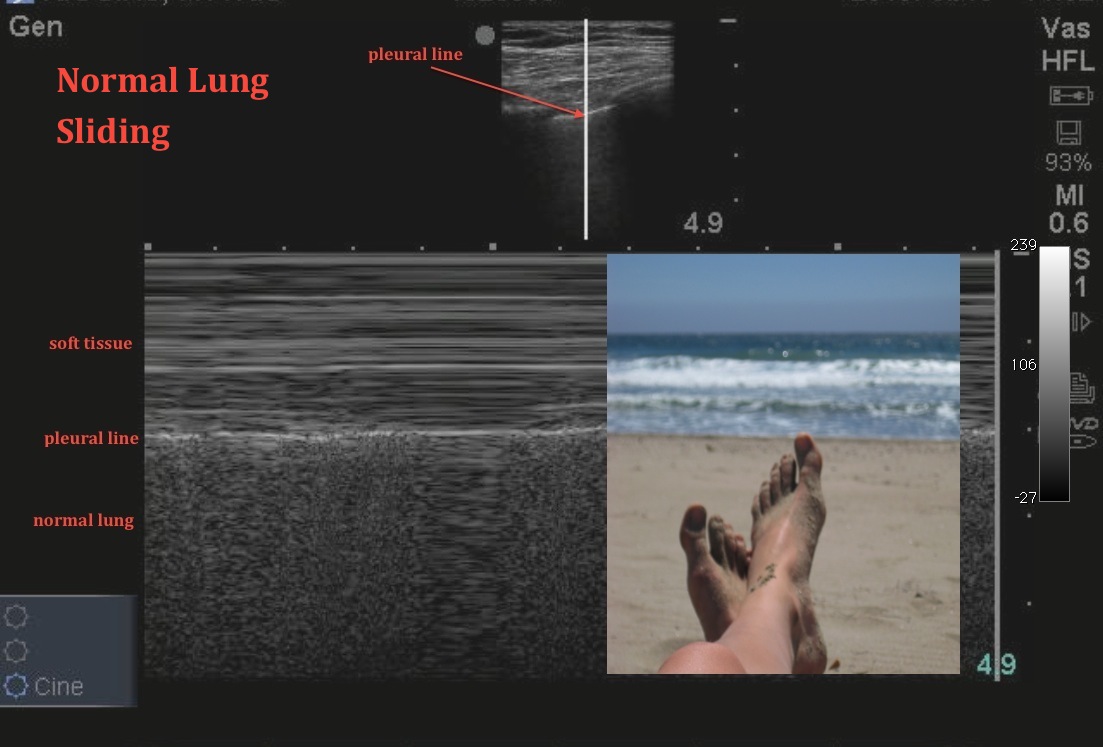
In this image, the M-mode cursor is placed over the pleural line. Here we can see as the lung moves beneath the plural line, the M-mode image takes on the appearance of sand as the returning echoes change with the respiratory cycle. This is a normal lung. In a patient with a pneumothorax, there is no movement beneath the pleural line and the areas above and below the pleural line look similar, giving the image the appearance of a barcode.
Date: February 2013